Control Tower
Control Tower is the live runtime operations workspace: operators watch active pipelines, inspect live topology, and drive workload lifecycle (Start, Stop, Restart) on a single PADAS Core. The page is built for operational visibility during steady state and incidents—execution graphs, stage health, and throughput overlays summarize what the engine is doing now, not what configuration files describe in the abstract.
The UI orchestrates and visualizes; the Core executes pipelines and returns runtime state and metrics. What you see here is orchestration and runtime diagnostics on top of that data plane.
Runtime scope
| Rule | Detail |
|---|---|
| One Core | Every card, metric, and action is scoped to the selected Core instance. |
| No cross-Core view | There is no aggregation across Cores on this page. |
| Action blast radius | Start, Stop, Restart, and related controls affect only the bound Core’s workloads. |
| State variance | Runtime state can differ between Cores; compare Cores by switching the selector, not from a combined dashboard here. |
Selecting a Core
Use the Core selector to bind the workspace to one management endpoint (Host / Port as registered). Changing Core reloads runtime-backed content for that engine. Reachability is reflected by whether the UI can load live topology and metrics for that selection.
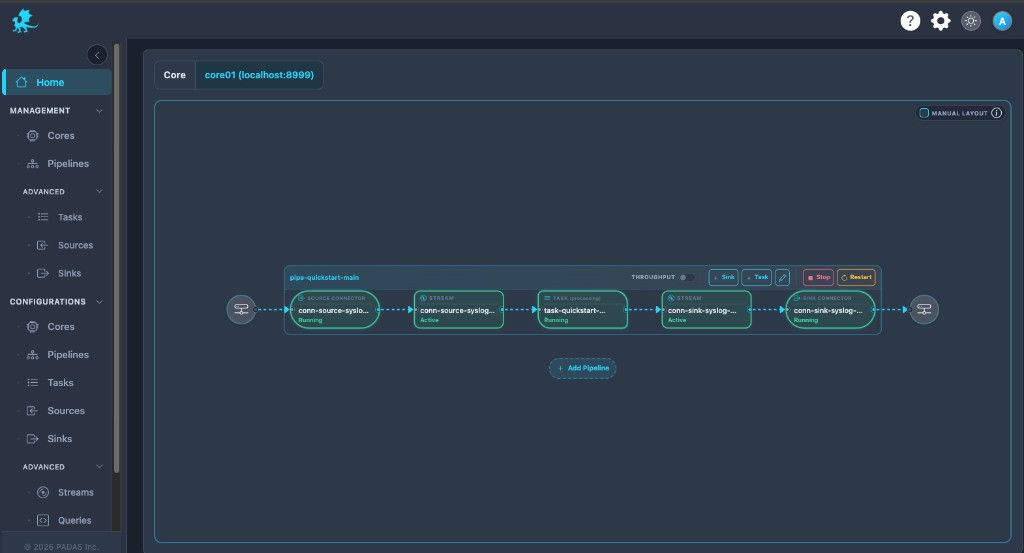
Pipeline graph
Pipelines render as execution graphs: sources, streams, tasks, and sinks appear as ordered runtime stages along the event flow. Visual indicators show activity and health so operators can spot inactive, stopped, or failed stages without opening registry editors.
Streams are first-class nodes—they show how data moves on the Core and may offer inspect or sample affordances where the product exposes them. Durable stream tuning remains under Streams.
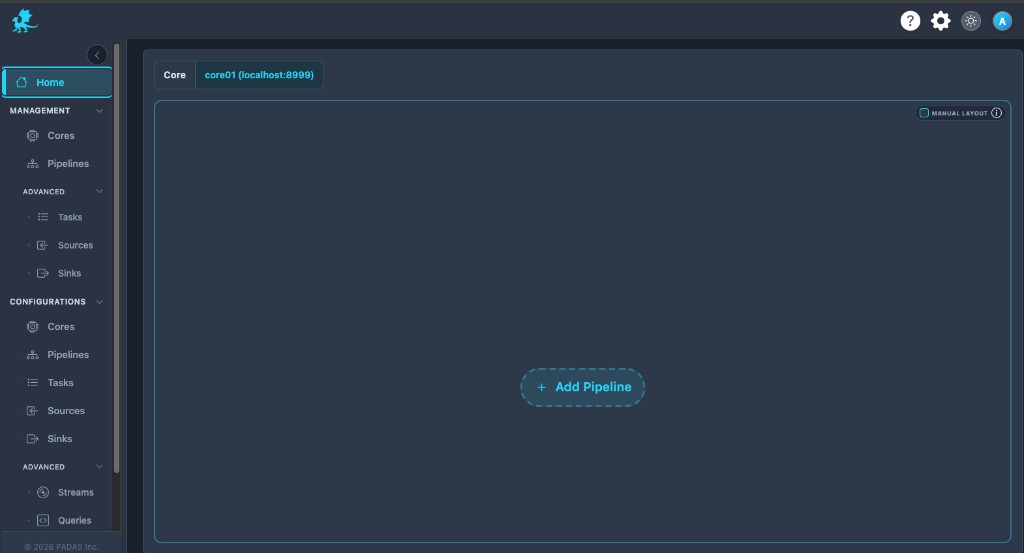
An empty graph means no pipelines are currently attached to the selected Core—it does not by itself prove a registration fault. Core connectivity may still be healthy. Use + Add Pipeline to attach workloads (exact prerequisites follow your build).
Layout — Dragging or rearranging nodes is visual only unless the product offers an explicit save path; moving nodes does not change runtime topology or registry definitions.
Runtime controls
Toolbar and card actions implement runtime lifecycle operations on the pipeline attached to the selected Core:
| Control | Role |
|---|---|
| Start / Stop / Restart | Change pipeline execution state on that Core. |
| Throughput | Toggles throughput overlays (rates / volumes on edges) for runtime diagnostics without replacing topology. |
| Edit | Opens editing in a runtime- or deployment-scoped context per product rules. |
| + Task / + Sink | Structural changes on the card when permitted for your role and build. |
Confirm dialogs and API behavior follow your release notes; live responses from the Core are authoritative. Some structural actions may be disabled or limited by deployment permissions.
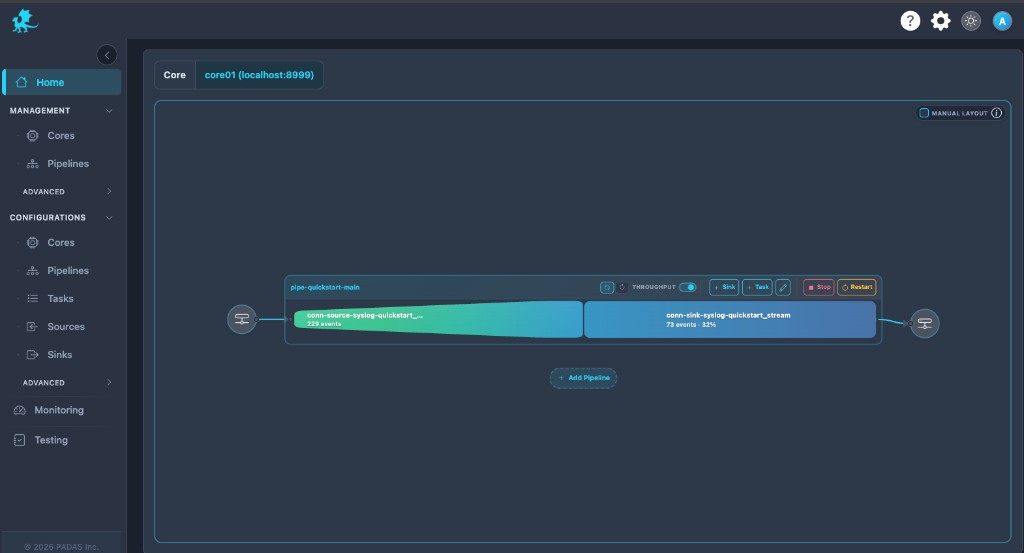
Throughput and visibility
Enable Throughput to overlay operational metrics on the same execution graph. Use it to:
- Compare ingress vs egress balance across stages.
- Spot stalled or overloaded segments when rates flatten or diverge.
- Trace processing flow visually before diving into logs or APM.
Turn overlays off when numbers obscure structural triage during fast-moving incidents.
Health and troubleshooting
Graph-level triage and escalation to Core logs / metrics are summarized under Troubleshooting & Logs → Control Tower.
Runtime vs configuration
| Layer | What it represents |
|---|---|
| Configuration (registry) | Desired topology—sources, tasks, streams, sinks, and pipeline definitions you author under Configuration in the UI. |
| Management | Assign and deploy—which components run on which Core, pipeline attachment, Deploy All, needs deploy reconciliation. |
| Control Tower | Live execution graph only—what is attached, running, stopped, or erroring right now on the selected Core (runtime visibility, not registry editing). |
Runtime state may temporarily diverge from registry intent (for example during deploys, restarts, or partial failures). Resolve drift on Management and Configuration pages; use Control Tower to observe and drive runtime lifecycle on the running system.
Runtime actions apply only to the selected Core instance. They do not replace Deploy All or Cores deploy flows—fix deployment drift from Management when symptoms point to stale topology.
Related pages
- Management → Cores — component assign / deploy, needs deploy
- Management → Pipelines — pipeline Assign, Deploy All, row Status
- Pipelines — registry topology definitions
- Cores — engine registration
- Streams — stream parameters