
Buffer Overflows: Why Old Bugs Still Matter

· 6 min read

Buffer Overflow

After 25 years in information security, I've seen my fair share of vulnerabilities come and go. There's one classic that never seems to fade away: the humble buffer overflow. From my early days writing C/C++ code and hunting down memory leaks, to performing white hat hacking and teaching security training with sample overflow exploits, I've witnessed firsthand how this seemingly simple memory management issue can cause major problems. Buffer overflows aren't just academic exercises or relics from the 1990s; they're still very much alive in today's high-performance systems, and they're particularly relevant when building software that need to handle millions of events per second reliably.

A buffer overflow happens when a program writes more data into memory than the allocated space allows. Instead of stopping, the excess data spills into adjacent memory. That corruption can cause crashes, data leaks, or — in the most dangerous cases — remote code execution.

What is OpenTelemetry and How to Use It? – A Beginner's Guide

· 9 min read
Beste KY
Full-Stack Developer

Welcome! In this comprehensive guide, I'll walk you through OpenTelemetry (OTel) in a friendly and approachable way—what it is, why it matters, and how you can use it effectively. I'll break down technical terms like telemetry (data about your app's performance) and observability (understanding what's happening inside your system) to make everything crystal clear. We'll build a practical JavaScript example together, and I'll explain OpenTelemetry's architecture step by step. This guide is up-to-date as of September 2025, including the latest features like OpenTelemetry Collector v1.0.


1. What is OpenTelemetry?

OpenTelemetry is an open-source observability framework developed by the Cloud Native Computing Foundation (CNCF). It collects, processes, and sends telemetry data—like traces, metrics, and logs—from your applications to analysis tools (e.g., Prometheus, Jaeger, Datadog). Born in 2019 from the merger of OpenTracing and OpenCensus, it's now the go-to standard for observability.

📊 The Three Pillars of Observability

OpenTelemetry Data Types

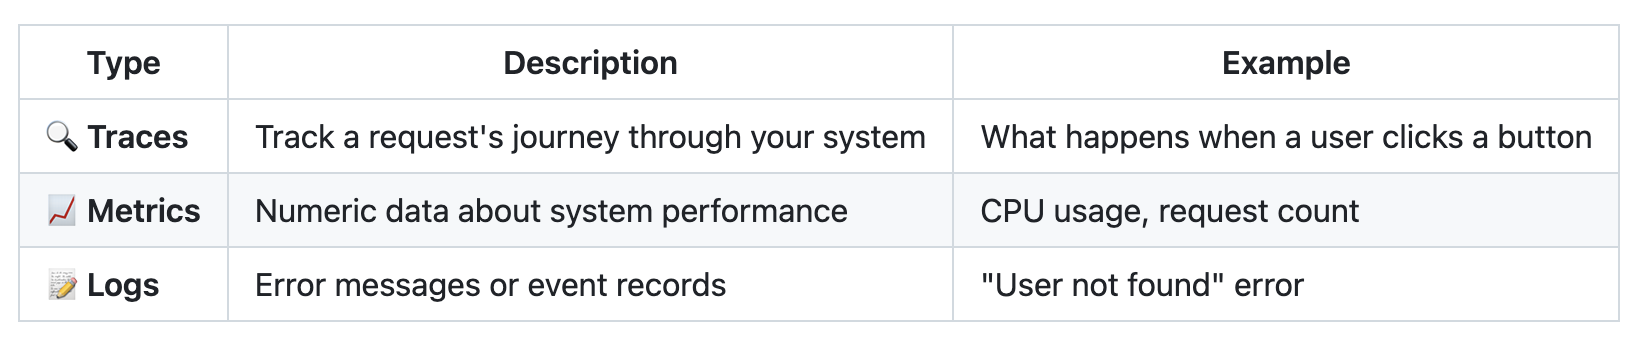
Table 1. The three pillars of observability in OpenTelemetry: traces, metrics, and logs. This diagram illustrates how each data type provides different insights into application behavior and system performance. Source: Created by the author.

💡 Key Insight: OpenTelemetry gathers this data in a standardized way, preventing vendor lock-in and working seamlessly with multiple analysis tools.

🆕 2025 Update

At KubeCon EU 2025, OpenTelemetry was declared the "de facto standard." A new tool called Weaver automates telemetry. In JavaScript, traces and metrics are stable, while logs are still in development. Over 12 platforms (Splunk, AWS, Dynatrace) are fully compatible.

Security Telemetry Pipelines: The Missing Link in Modern Security Architecture

· 6 min read

In today's rapidly evolving cybersecurity landscape, security teams face unprecedented challenges. They're dealing with exponential growth of security data, alert fatigue from increasingly sophisticated adversaries, and a critical shortage of skilled analysts.

The goal for security operations centers (SOC) has remained largely the same: lower MTTD (Mean Time to Detect) and MTTR (Mean Time to Respond), reduce false positives, and scale as needed. However, achieving these goals has become exponentially more difficult.

In this context, security telemetry pipelines aren't just enhancements—they're becoming a necessity. In a world where terabytes of data flood your SIEM daily, real-time context (e.g., reasoning and detection logic with security ontologies) and intelligent filtering can no longer be optional.