What is OpenTelemetry and How to Use It? – A Beginner's Guide

Welcome! In this comprehensive guide, I'll walk you through OpenTelemetry (OTel) in a friendly and approachable way—what it is, why it matters, and how you can use it effectively. I'll break down technical terms like telemetry (data about your app's performance) and observability (understanding what's happening inside your system) to make everything crystal clear. We'll build a practical JavaScript example together, and I'll explain OpenTelemetry's architecture step by step. This guide is up-to-date as of September 2025, including the latest features like OpenTelemetry Collector v1.0.
1. What is OpenTelemetry?
OpenTelemetry is an open-source observability framework developed by the Cloud Native Computing Foundation (CNCF). It collects, processes, and sends telemetry data—like traces, metrics, and logs—from your applications to analysis tools (e.g., Prometheus, Jaeger, Datadog). Born in 2019 from the merger of OpenTracing and OpenCensus, it's now the go-to standard for observability.
📊 The Three Pillars of Observability
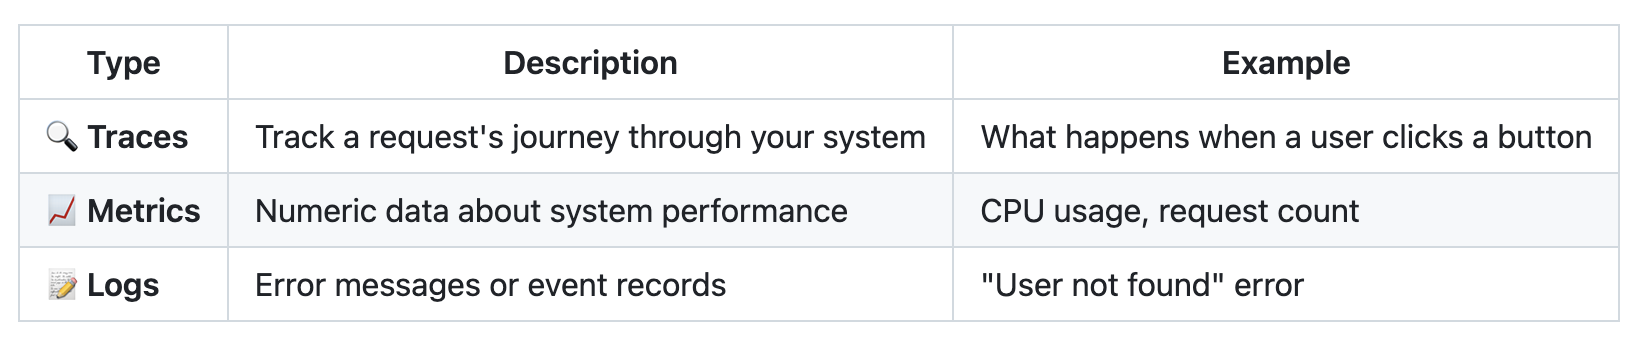
Table 1. The three pillars of observability in OpenTelemetry: traces, metrics, and logs. This diagram illustrates how each data type provides different insights into application behavior and system performance. Source: Created by the author.
💡 Key Insight: OpenTelemetry gathers this data in a standardized way, preventing vendor lock-in and working seamlessly with multiple analysis tools.
🆕 2025 Update
At KubeCon EU 2025, OpenTelemetry was declared the "de facto standard." A new tool called Weaver automates telemetry. In JavaScript, traces and metrics are stable, while logs are still in development. Over 12 platforms (Splunk, AWS, Dynatrace) are fully compatible.
2. Why Use OpenTelemetry?
Modern systems (think microservices or Kubernetes) are complex, and pinpointing issues can be tough. OpenTelemetry simplifies this. Here's why it's awesome:
🌟 Key Benefits
🔓 Open Source
Free and community-driven (1,106 companies contribute; Splunk 27%, Microsoft 17%)
🌐 Vendor-Neutral
Works with AWS, Google Cloud, Azure, and more
🤖 Automatic Instrumentation
Adds telemetry without code changes
📡 Standard Protocol (OTLP)
Ensures consistent data across platforms
🚀 Production-Ready
Stable in Java, Python, Go, JavaScript, and more
💰 Cost Savings
Avoid hefty bills (e.g., OpenAI's Datadog bill was $100M+)
📈 2025 Trends
Open-source tools like Prometheus (89%) and OpenTelemetry (85%) are booming. 40% of companies use both, and 50% are adopting proactive observability and AI integration (e.g., anomaly detection).
3. OpenTelemetry Architecture
OpenTelemetry collects, processes, and sends telemetry data (traces, metrics, logs) in a modular, scalable way. Here are the core components:
🔧 Core Components Overview
🔌 Instrumentation
Adds code to your app to generate telemetry data. This can be manual (you write the code) or automatic (using libraries, e.g., auto-tracing for Express).🛠️ APIs and SDKs
Provide standard interfaces (API) and language-specific tools (SDK). For example, use Tracer for traces and Meter for metrics. SDKs collect and export data.📦 OpenTelemetry Collector
A central tool that receives, processes, and sends data to analysis tools. In 2025, v1.0 supports large-scale systems.📤 Exporting
Sends data to tools like Jaeger (traces), Prometheus (metrics), or commercial platforms (Datadog, New Relic).🔗 Context Propagation
Uses W3C Trace Context to connect traces across systems (e.g., tracking a request across microservices).
🎛️ OpenTelemetry Collector Components
The OpenTelemetry Collector is the heart of telemetry data collection, processing, and routing. It has three main components:
1. Receivers
What They Do: Collect telemetry data (traces, metrics, logs) from apps or other sources.
Types:
- 🔗 OTLP (OpenTelemetry Protocol): Receives traces, metrics, and logs via HTTP or gRPC. Most common receiver.
- 🔍 Jaeger: Collects tracing data in Jaeger format.
- 📊 Prometheus: Gathers metrics in Prometheus format.
- 📦 Zipkin: Supports Zipkin tracing data.
- 🚀 Kafka: Pulls data from message queues.
- ☁️ AWS X-Ray, Fluentd, StatsD: For specialized formats.
Example: If your app sends data via OTLP, the Collector's otlp receiver catches it (e.g., http://localhost:4318/v1/traces).
2. Processors
What They Do: Filter, transform, or optimize data to reduce noise and improve efficiency.
Types:
- 📦 Batch: Groups data for efficient sending (e.g., sends 1024 items at once).
- 🏷️ Attributes: Adds or edits metadata (e.g., adds region info to a service).
- 🔍 Filter: Keeps or discards specific data (e.g., only error traces).
- 📊 Sampling: Retains a percentage of traces (e.g., 10% of traces).
- 🖥️ Resource: Adds source info (e.g., hostname, version).
Example: The batch processor groups data to reduce network load.
3. Exporters
What They Do: Send processed data to analysis tools or storage systems.
Types:
- 🔗 OTLP: Sends data to another Collector or compatible system (HTTP/gRPC).
- 🔍 Jaeger: Forwards traces to Jaeger (e.g.,
http://localhost:14268/api/traces). - 📊 Prometheus: Exposes metrics for Prometheus (e.g.,
http://localhost:8889/metrics). - 📝 Logging: Writes data to the console or log files (for debugging).
- ☁️ AWS X-Ray, Datadog, New Relic: Sends data to commercial tools.
- 🚀 Kafka: Pushes data to message queues.
Example: The prometheus exporter makes metrics available at an endpoint for Prometheus to scrape.
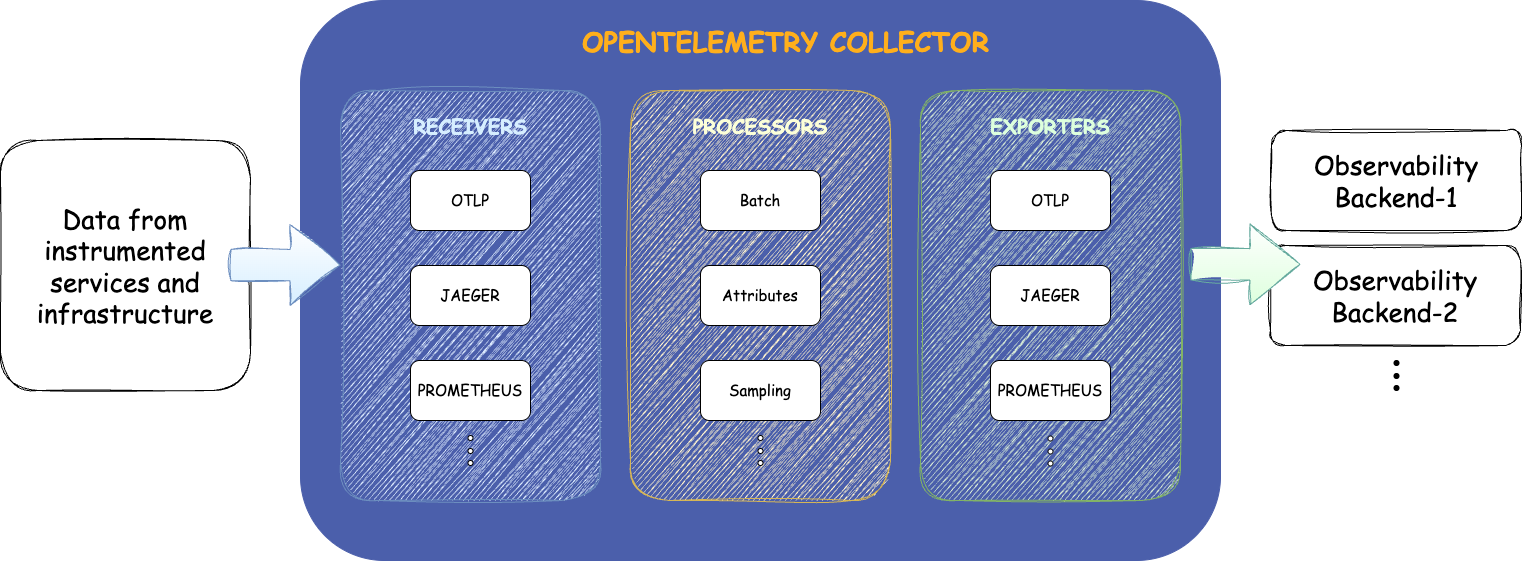
Figure 1. OpenTelemetry Collector architecture showing receivers, processors, and exporters. Source: Created by the author.
📋 Summary: The Collector receives data, processes it, and exports it to analysis tools. Its modular design adapts to various systems and needs.
4. OpenTelemetry in Action: Node.js Example
Let's build a dice-rolling app to show OpenTelemetry's tracing and metrics in action. The app handles user requests and returns random dice roll results.
🎯 What We'll Build
- A simple Express.js server with a
/rolldiceendpoint - OpenTelemetry tracing to track request flow
- Metrics collection for request counting
- Integration with Jaeger for trace visualization
- Prometheus metrics export
📁 Step 1: Project Setup
mkdir otel-dice-app
cd otel-dice-app
npm init -y
npm install express @opentelemetry/api @opentelemetry/sdk-node \
  @opentelemetry/exporter-jaeger @opentelemetry/exporter-trace-otlp-http \
  @opentelemetry/exporter-metrics-otlp-http @opentelemetry/resources \
  @opentelemetry/semantic-conventions @opentelemetry/sdk-trace-node \
  @opentelemetry/sdk-metrics @opentelemetry/instrumentation-express
Project File Structure
After setup, your project directory will look like this:
otel-dice-app/
├── package.json                 # Node.js dependencies and scripts
├── package-lock.json           # Locked dependency versions
├── instrumentation.js          # OpenTelemetry configuration
├── app.js                      # Express application with tracing
├── docker-compose.yml          # Docker services (Jaeger + Collector)
├── otel-collector-config.yaml  # OpenTelemetry Collector configuration
└── node_modules/               # Installed packages
    ├── @opentelemetry/
    ├── express/
    └── ...
Key Files Explained:
instrumentation.js: Sets up OpenTelemetry SDK, exporters, and resource configurationapp.js: Main Express application with tracing and metrics instrumentationdocker-compose.yml: Defines Jaeger and OpenTelemetry Collector servicesotel-collector-config.yaml: Configures how the Collector processes and routes telemetry data
⚙️ Step 2: OpenTelemetry Configuration
Create instrumentation.js:
const { NodeSDK } = require('@opentelemetry/sdk-node');
const { ConsoleSpanExporter } = require('@opentelemetry/sdk-trace-node');
const { JaegerExporter } = require('@opentelemetry/exporter-jaeger');
const { OTLPTraceExporter } = require('@opentelemetry/exporter-trace-otlp-http');
const {
  PeriodicExportingMetricReader,
  ConsoleMetricExporter
} = require('@opentelemetry/sdk-metrics');
const { OTLPMetricExporter } = require('@opentelemetry/exporter-metrics-otlp-http');
const { resourceFromAttributes } = require('@opentelemetry/resources');
const {
  ATTR_SERVICE_NAME,
  ATTR_SERVICE_VERSION
} = require('@opentelemetry/semantic-conventions');

const isProduction = process.env.NODE_ENV === 'production';
const useCollector = process.env.USE_COLLECTOR === 'true';

const traceExporter = isProduction
  ? (useCollector
    ? new OTLPTraceExporter({ url: 'http://localhost:4318/v1/traces' })
    : new JaegerExporter({ endpoint: 'http://localhost:14268/api/traces' }))
  : new ConsoleSpanExporter();

const metricExporter = isProduction
  ? (useCollector
    ? new OTLPMetricExporter({ url: 'http://localhost:4318/v1/metrics' })
    : new ConsoleMetricExporter())
  : new ConsoleMetricExporter();

const sdk = new NodeSDK({
  resource: resourceFromAttributes({
    [ATTR_SERVICE_NAME]: 'dice-server',
    [ATTR_SERVICE_VERSION]: '0.1.0'
  }),
  traceExporter,
  metricReader: new PeriodicExportingMetricReader({ exporter: metricExporter })
});
sdk.start();
🚀 Step 3: Express Application
Create app.js:
const { trace, metrics } = require('@opentelemetry/api');
const express = require('express');

const tracer = trace.getTracer('dice-server', '0.1.0');
const meter = metrics.getMeter('dice-server', '0.1.0');
const counter = meter.createCounter('requests.count', {
  description: 'Total number of requests'
});

const app = express();

app.get('/rolldice', (req, res) => {
  const span = tracer.startSpan('rolldice-request');
  counter.add(1);

  const rolls = parseInt(req.query.rolls) || NaN;
  if (isNaN(rolls)) {
    span.setAttribute('error', 'Invalid rolls parameter');
    span.end();
    return res.status(400).send(
      'Rolls parameter is missing or not a number.'
    );
  }

  const result = Array.from({ length: rolls }, () =>
    Math.floor(Math.random() * 6) + 1
  );
  span.setAttribute('rolls.count', rolls);
  span.end();
  res.json(result);
});

app.listen(8080, () =>
  console.log('Server running at http://localhost:8080')
);
🐳 Step 4: Docker and Collector Setup
Create docker-compose.yml:
version: '3.8'
services:
  jaeger:
    image: jaegertracing/all-in-one:latest
    ports:
      - "16686:16686"
      - "14268:14268"
      - "14250:14250"
    environment:
      - COLLECTOR_OTLP_ENABLED=true
    networks:
      - otel-network
  otel-collector:
    image: otel/opentelemetry-collector-contrib:latest
    command: ["--config=/etc/otel-collector-config.yaml"]
    volumes:
      - ./otel-collector-config.yaml:/etc/otel-collector-config.yaml
    ports:
      - "4317:4317"
      - "4318:4318"
      - "8889:8889"
    depends_on:
      - jaeger
    networks:
      - otel-network
networks:
  otel-network:
    driver: bridge
Create otel-collector-config.yaml:
receivers:
  otlp:
    protocols:
      grpc:
        endpoint: 0.0.0.0:4317
      http:
        endpoint: 0.0.0.0:4318
processors:
  batch:
    timeout: 1s
    send_batch_size: 1024
exporters:
  debug:
    verbosity: detailed
  prometheus:
    endpoint: "0.0.0.0:8889"
  otlp/jaeger:
    endpoint: jaeger:4317
    tls:
      insecure: true
service:
  pipelines:
    traces:
      receivers: [otlp]
      processors: [batch]
      exporters: [otlp/jaeger, debug]
    metrics:
      receivers: [otlp]
      processors: [batch]
      exporters: [prometheus, debug]
▶️ Step 5: Run the Application
1. Start Docker services
docker-compose up -d
2. Run the app (with Collector)
NODE_ENV=production USE_COLLECTOR=true node --require ./instrumentation.js app.js
3. Test requests
curl "http://localhost:8080/rolldice?rolls=3"
curl "http://localhost:8080/rolldice?rolls=abc"
👀 Step 6: View the Data
Monitoring Dashboards
- 🔍 Jaeger UI: http://localhost:16686 (select dice-server)
- 📊 Prometheus Metrics: http://localhost:8889/metrics
📈 Sample Metric Output
5. OpenTelemetry's Key Features
🌍 Multi-Language Support
Stable for JavaScript, Python, Java, Go (traces and metrics)
🤖 Automatic Instrumentation
Works with frameworks like Express or Flask without code changes
🔧 Flexibility
Compatible with 90+ tools (Datadog, Splunk)
☁️ Use Cases
Ideal for microservices, cloud, and distributed systems
🎉 Wrapping Up
OpenTelemetry makes it easy to monitor your systems and troubleshoot issues by collecting telemetry data. It's open-source, flexible, and a breeze to set up. In 2025, it's the standard for observability, with cost savings and AI integration making it a game-changer.
🚀 Ready to get started? Visit opentelemetry.io/docs!
📚 Resources
- OpenTelemetry Official Documentation - Comprehensive guides, APIs, SDKs, and best practices
- IMESH OpenTelemetry Blog - Simplified introduction with microservices focus
- DataGravity OpenTelemetry Guide - Detailed technical explanations and tutorials
- OpenTelemetry.io - Official website and community resources