Quick Start
Use Padas to perform streaming event data transformations and implement security monitoring pipelines for threat detection. This quick start guide demonstrates how to process FortiNet network traffic logs, transform them into structured OCSF format, and detect potential ICMP-based attacks through real-time aggregation. This guide assumes all components (Confluent Kafka and Padas) will be installed on the same machine. In production, it is recommended to separate out these components on different nodes/hosts.
Prerequisites
- Internet connectivity
- Review System Requirements
- Kafka (Apache, Confluent Community, etc.) must be installed and running (locally) (e.g. Quick Start for Confluent Platform).
- You should have at least Kafka Broker and Controller (or Zookeeper) services up and running.
Overview of Quickstart
Below diagram shows what will be accomplished with this quick start guide.
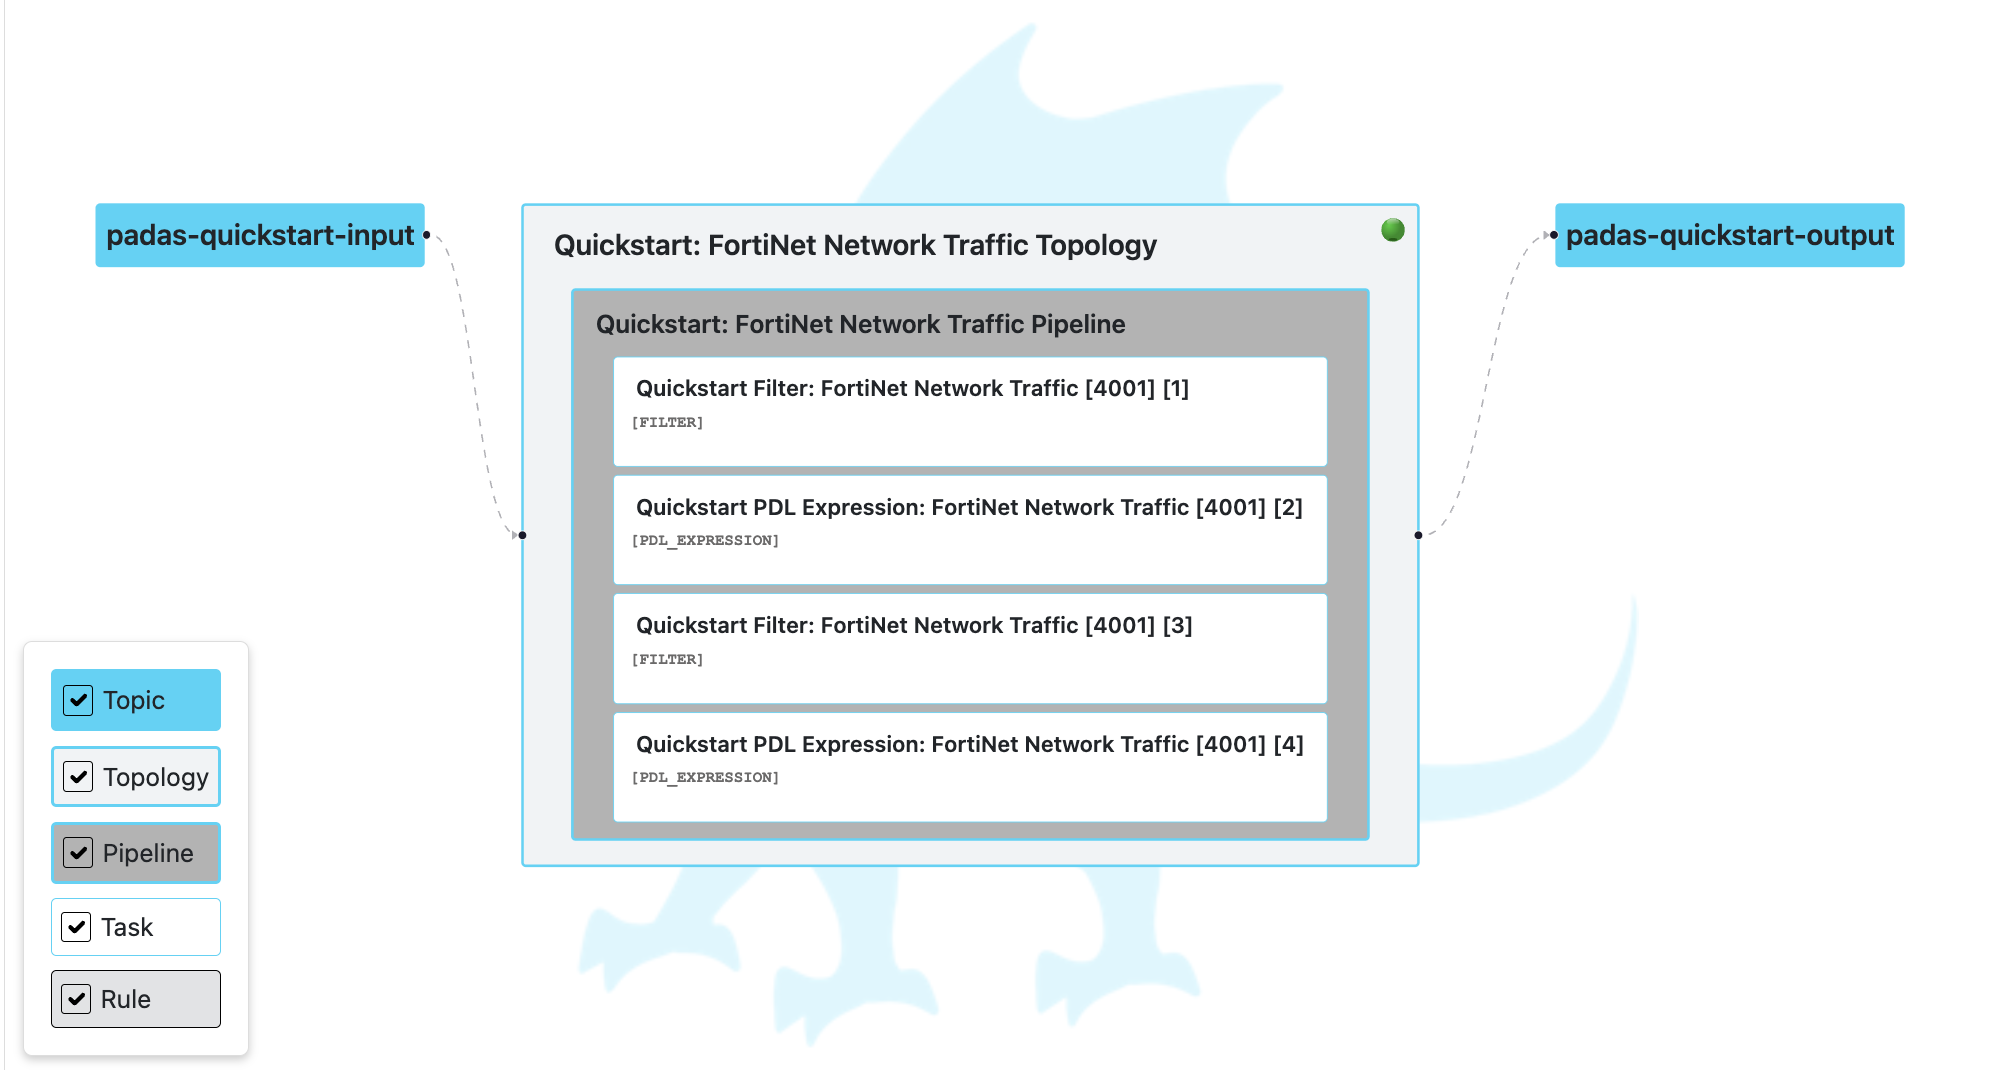
We will process FortiNet network traffic logs through a comprehensive security monitoring pipeline. Our goal will be to transform raw log data into structured OCSF format and implement ICMP-based attack detection through multi-step processing tasks.
Sample input:
{
  "date": "2025-07-03",
  "time": "11:35:00",
  "tz": "+0300",
  "logid": "0000000010",
  "type": "traffic",
  "subtype": "forward",
  "level": "notice",
  "vd": "vdom1",
  "srcip": "192.168.1.20",
  "dstip": "203.0.113.42",
  "srcname": "pc2",
  "srcport": 65535,
  "srcintf": "port8000",
  "srcintfrole": "undefined",
  "dstname": "forti1",
  "dstport": 53,
  "dstintf": "port80",
  "dstintfrole": "undefined",
  "poluuid": "123a0d88-c972-51e7-bbc7-4d421612337b",
  "sessionid": 8012,
  "proto": 6,
  "action": "server-rst",
  "policyid": 1,
  "policytype": "policy",
  "policymode": "learn",
  "service": "HTTPS",
  "dstcountry": "United States",
  "srccountry": "Turkey",
  "trandisp": "snat",
  "transip": "172.16.200.3",
  "transport": 40015,
  "appid": 40569,
  "app": "HTTPS.BROWSER",
  "appcat": "Web.Client",
  "apprisk": "medium",
  "duration": 1,
  "sentbyte": 0,
  "rcvdbyte": 100,
  "sentpkt": 20,
  "rcvdpkt": 12,
  "utmaction": "allowed",
  "countapp": "1",
  "devtype": "Linux PC",
  "osname": "Linux",
  "mastersrcmac": "a2:e9:00:ec:40:01",
  "srcmac": "a2:e9:00:ec:40:01",
  "srcserver": "0",
  "utmref": "0-220586"
}
After processing through our pipeline, the output will be aggregated data showing potential ICMP-based attacks:
Sample output:
{
  "padas": {
    "count": 1,
    "timestampBegin": 1754214926053,
    "timestampEnd": 1754214956053
  },
  "src_endpoint_port_values": [
    2000
  ],
  "src_endpoint_ip_values": [
    "192.168.1.10"
  ],
  "bytes_in_value": [
    900
  ],
  "protocol_name_values": [
    "icmp"
  ],
  "bytes_out_value": [
    700
  ],
  "bytes_values": [
    1600
  ],
  "dst_endpoint_port_values": [
    443
  ]
}
We will process this FortiNet network traffic data through a pipeline that includes:
- Filtering: Keep only traffic logs and UTM app-ctrl logs
- Transformation: Convert to OCSF schema format with enriched fields and normalized data
- Detection: Filter for large ICMP traffic (bytes > 1000) that is not activity_id 4
- Aggregation: Group by destination IP and count events over 30-second windows to detect potential ICMP-based attacks
NOTE: This demo showcases a comprehensive security monitoring pipeline that transforms raw FortiNet logs into structured OCSF format and implements ICMP-based attack detection. While this could be simplified with basic filtering, the multi-step approach demonstrates Padas's full capabilities for real-world security analytics scenarios.
Installation Steps
Step 1: Acquiring Padas
-
Download the latest version of Padas Engine and UI components from padas.io applicable to your platform.
padas-engine-1.0.0.tgz
padas-ui-1.0.0-linux-x64.tgz (or darwin) -
Use the
tarcommand to decompress the archive filetar -xzf padas-engine-1.0.0.tgz
tar -xzf padas-ui-1.0.0-linux-x64.tgz (or darwin) -
After extraction, combine the two
padasfolders. By default, twopadasdirectories are created:
One containing theuifolder
The other containing theenginefolderTo organize them into a single
padasdirectory, use the following structure:padas/
├── engine/ # Contents of padas-engine
└── ui/ # Contents of padas-ui -
By default, Padas Engine expects Kafka to be running on
localhost. If that's not the case, editpadas/engine/etc/padas.propertiesaccordingly. If thepadas.propertiesfile does not exist, copy thepadas.properties.examplefile to create it.
Step 2: Start Padas Engine
At this stage, make sure you have Confluent Kafka is running as mentioned in prerequisites.
-
Start engine node on the console. The script will ask you to accept the license agreement (enter
y or yes)cd padas/engine
bin/padas start -
Copy the token above and save it securely for later use with padas-ui
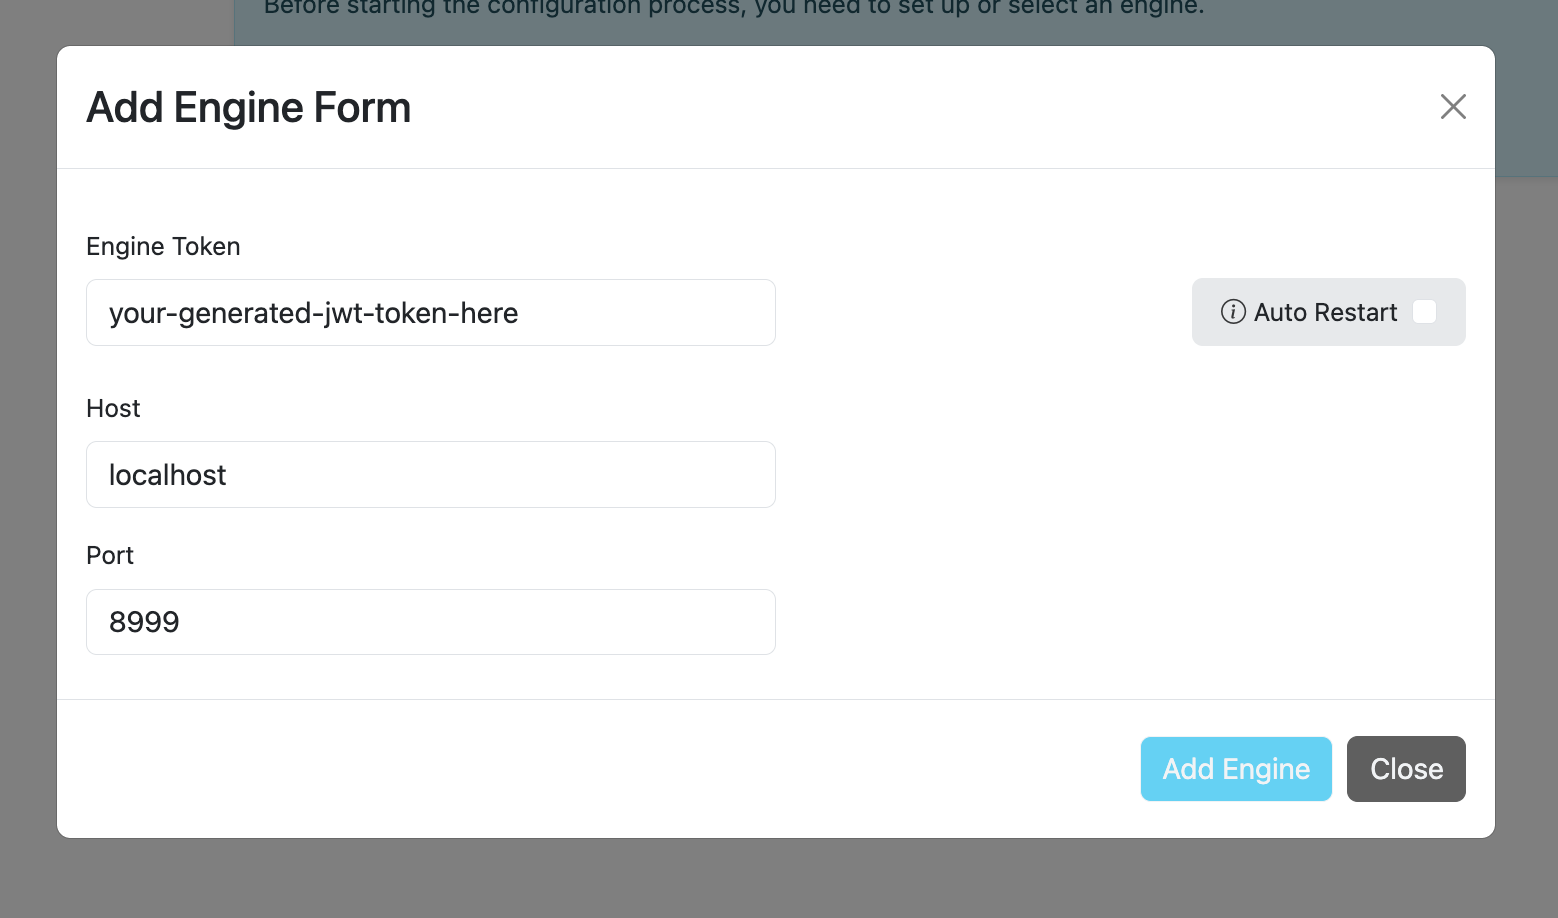
IMPORTANT: Please save this service account token in a secure location. You will need it to connect padas-ui to this engine instance.
Service Account Token: your-generated-jwt-token-hereNOTE: If Padas is configured to utilize Kafka (
padas.config.store=kafkain properties file) to store configurations you will need to create the required topics (configuration namespaces). If not, you will receive a warning as following on the console....
WARN Unable to describe required topics for Padas. Please create these topics in order to run the engine.
...NOTE: To stop the Padas engine, use the following command:
bin/padas stop
Step 3: Start Padas UI
-
Start UI component on the console. Default configuration connects to
localhostfor Padas Engine. The script will ask you to accept the license agreement (entery or yes)cd padas/ui
bin/padas start -
Access UI: Once the UI starts successfully, you will see a message indicating that Padas UI is running. Open your browser and navigate to the URL shown in the message (typically
http://localhost:5000). -
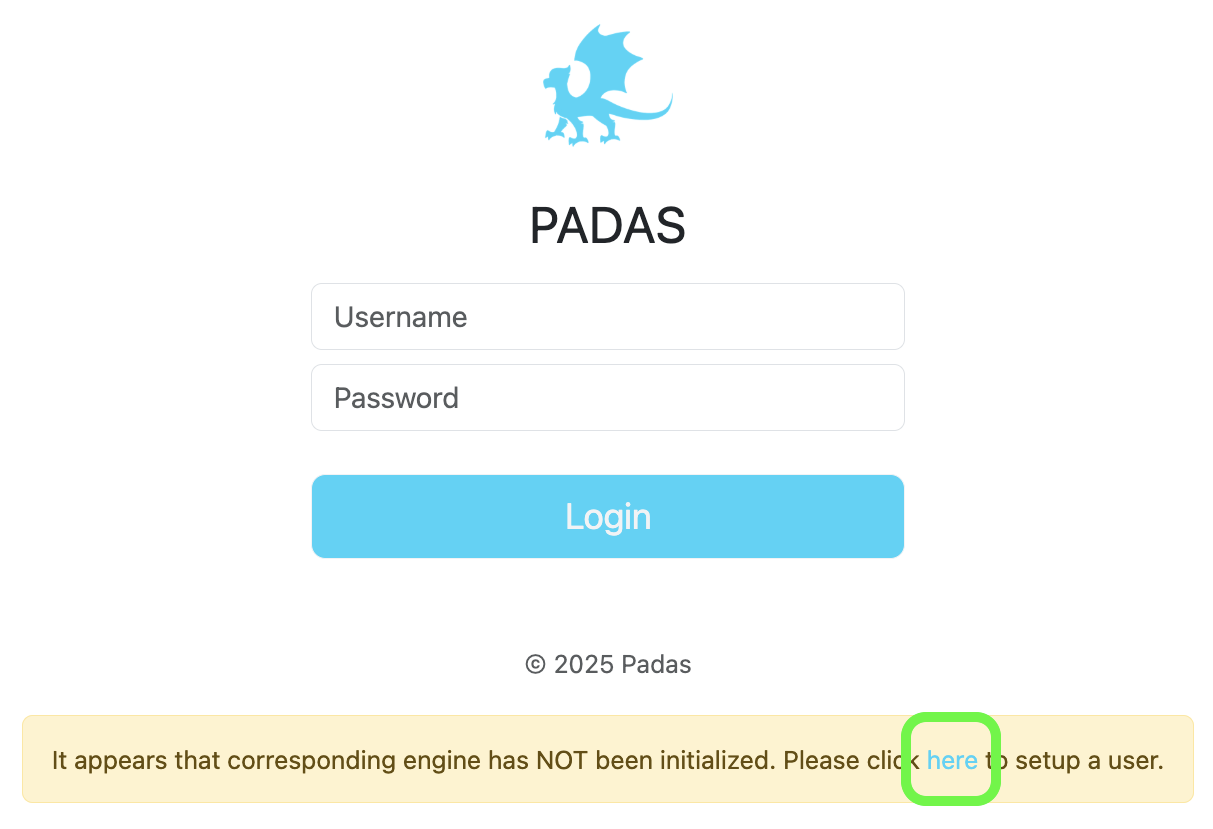
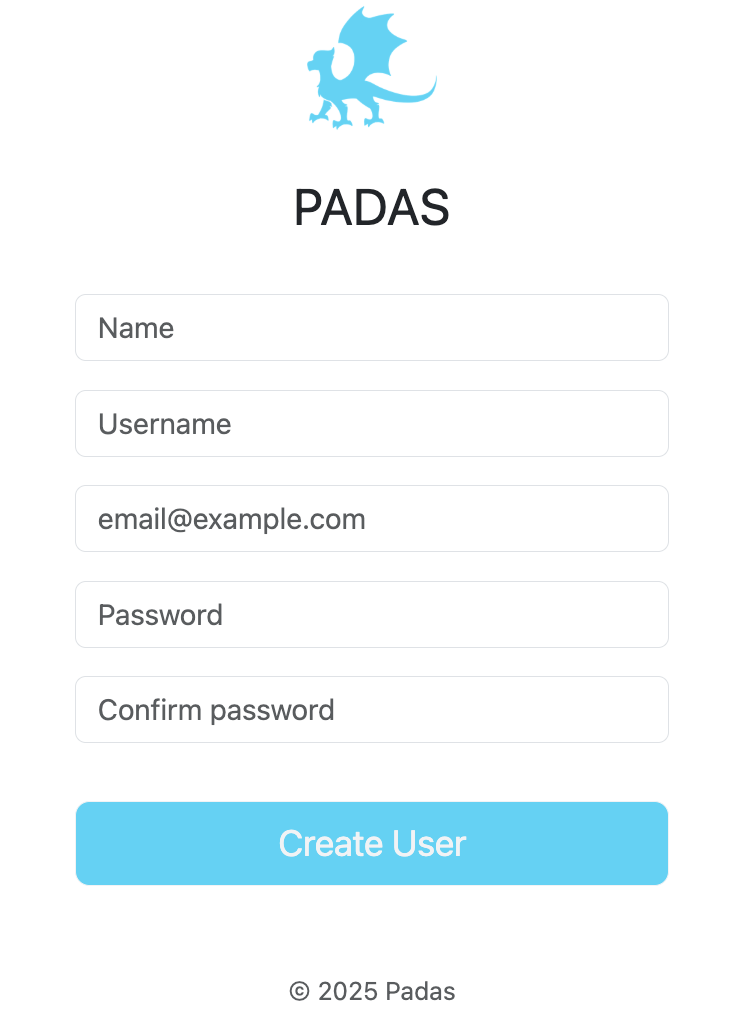
Initialize User: Go to https://localhost:5000 and since this is the first time, click the link below and create an administrator user.
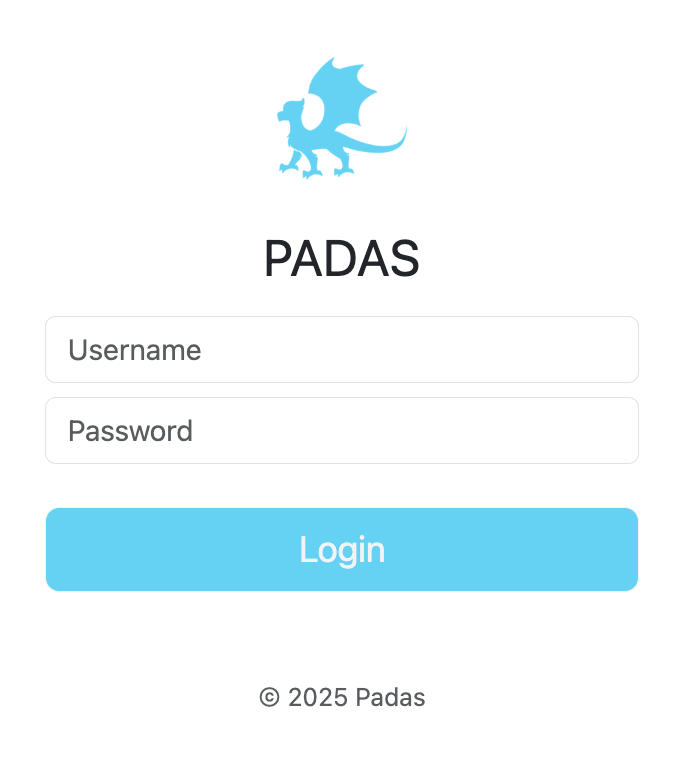
- Login: After initial user creation you will be redirected to Login screen; Login with the newly created user credentials.
Quick Start Steps
Step 4: Create an Engine and Add Engine Token
In this step, you will create a new engine instance and configure it with the necessary engine token for authentication and communication.

Step 5: Auto Configure and Generate Mock Data
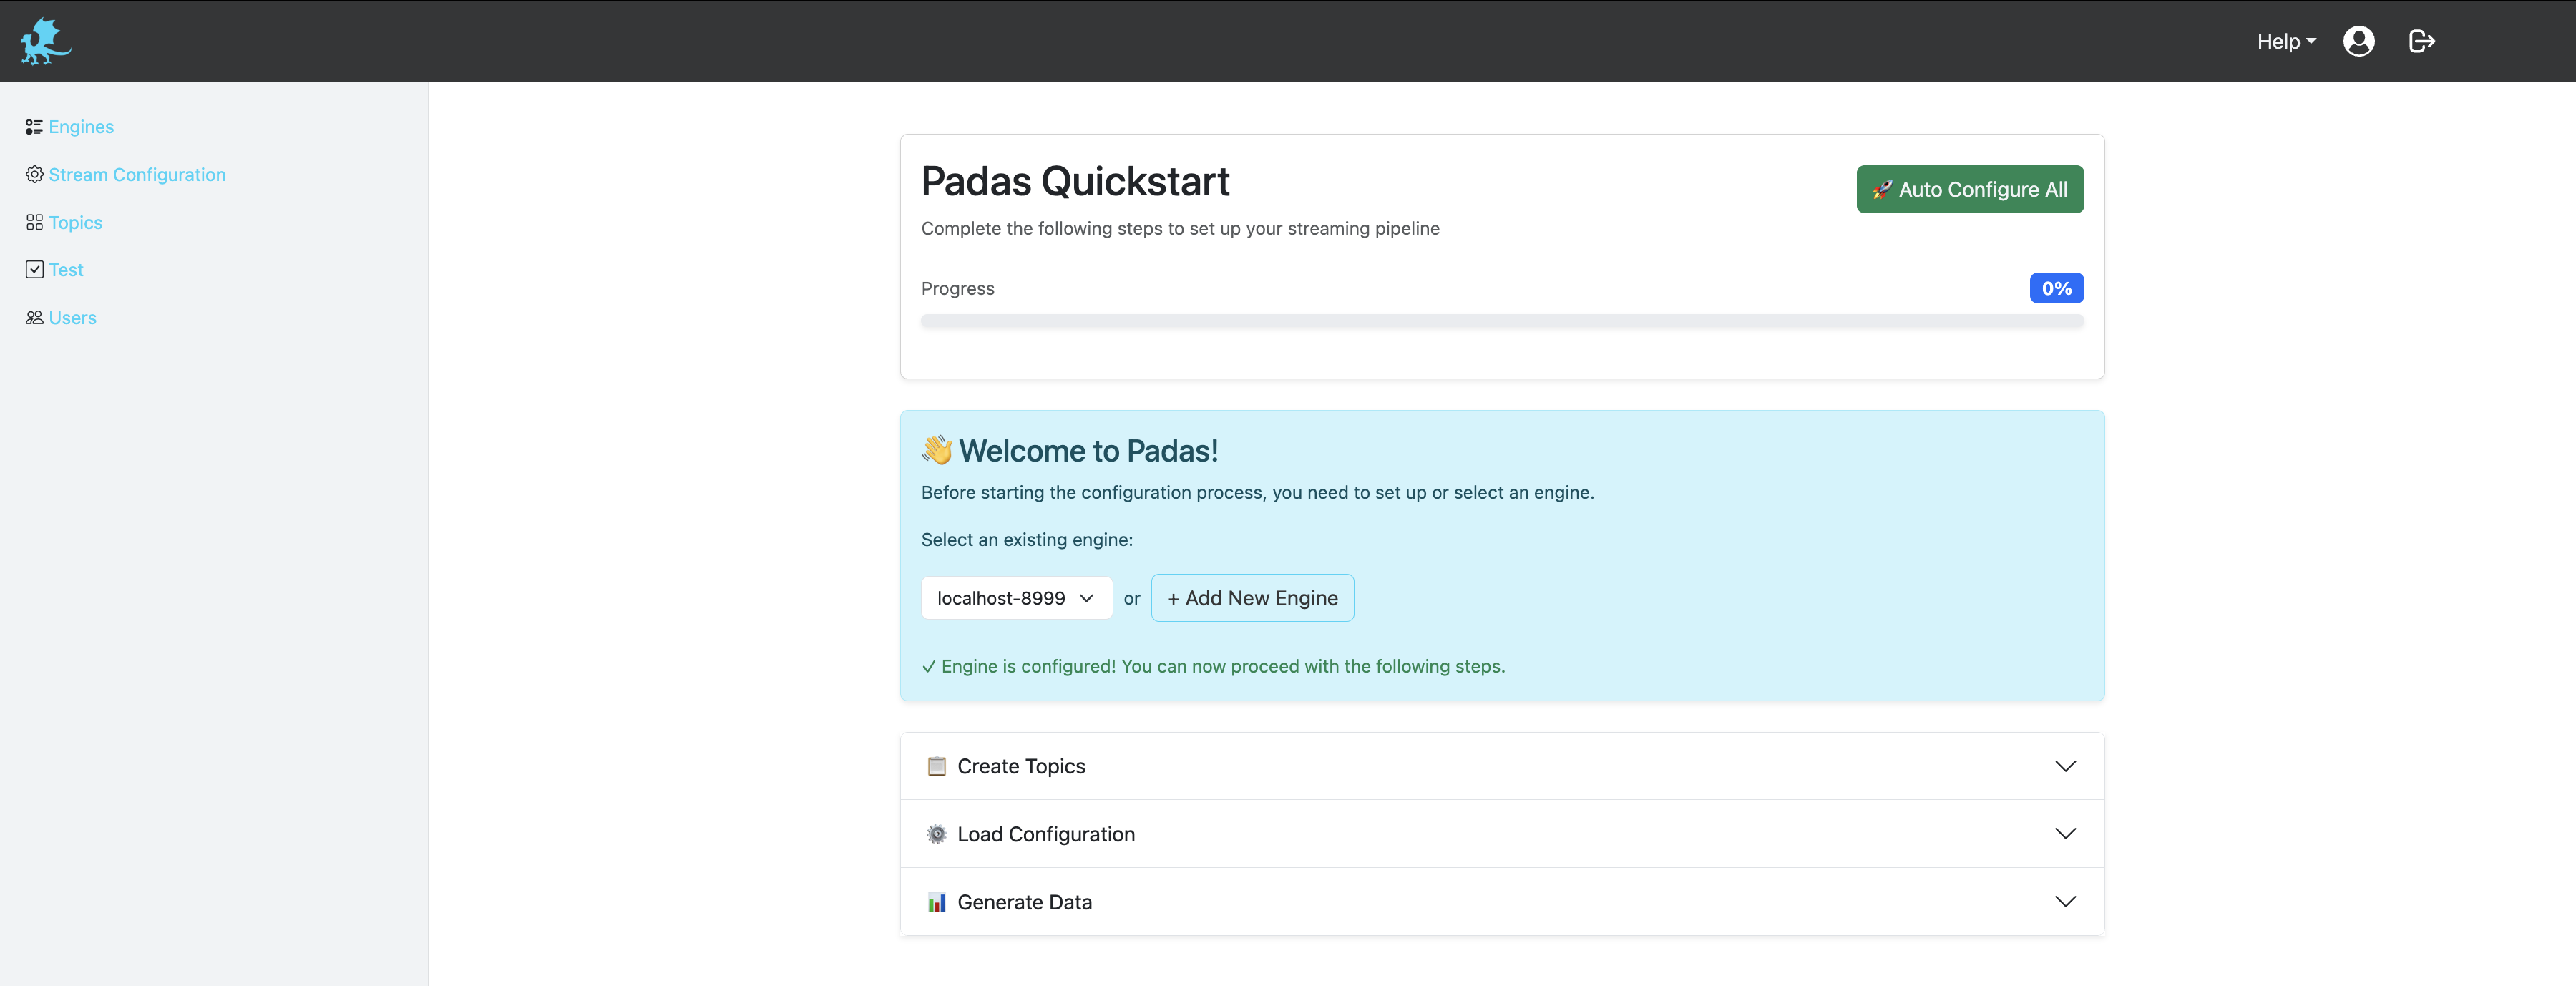
Click the "Auto Configure" button to automatically:
- Create required topics (test_input, test_output)
- Generate configuration files
- Set up pipeline configurations
- Generate mock data for testing
- Configure all necessary components for the demo
This automated setup will create all the required infrastructure and sample data needed to demonstrate Padas's capabilities.
Step 6: Monitor Output and Results
After the auto-configuration completes, you can:
- Monitor real-time data processing
- View transformed output in the structured OCSF format
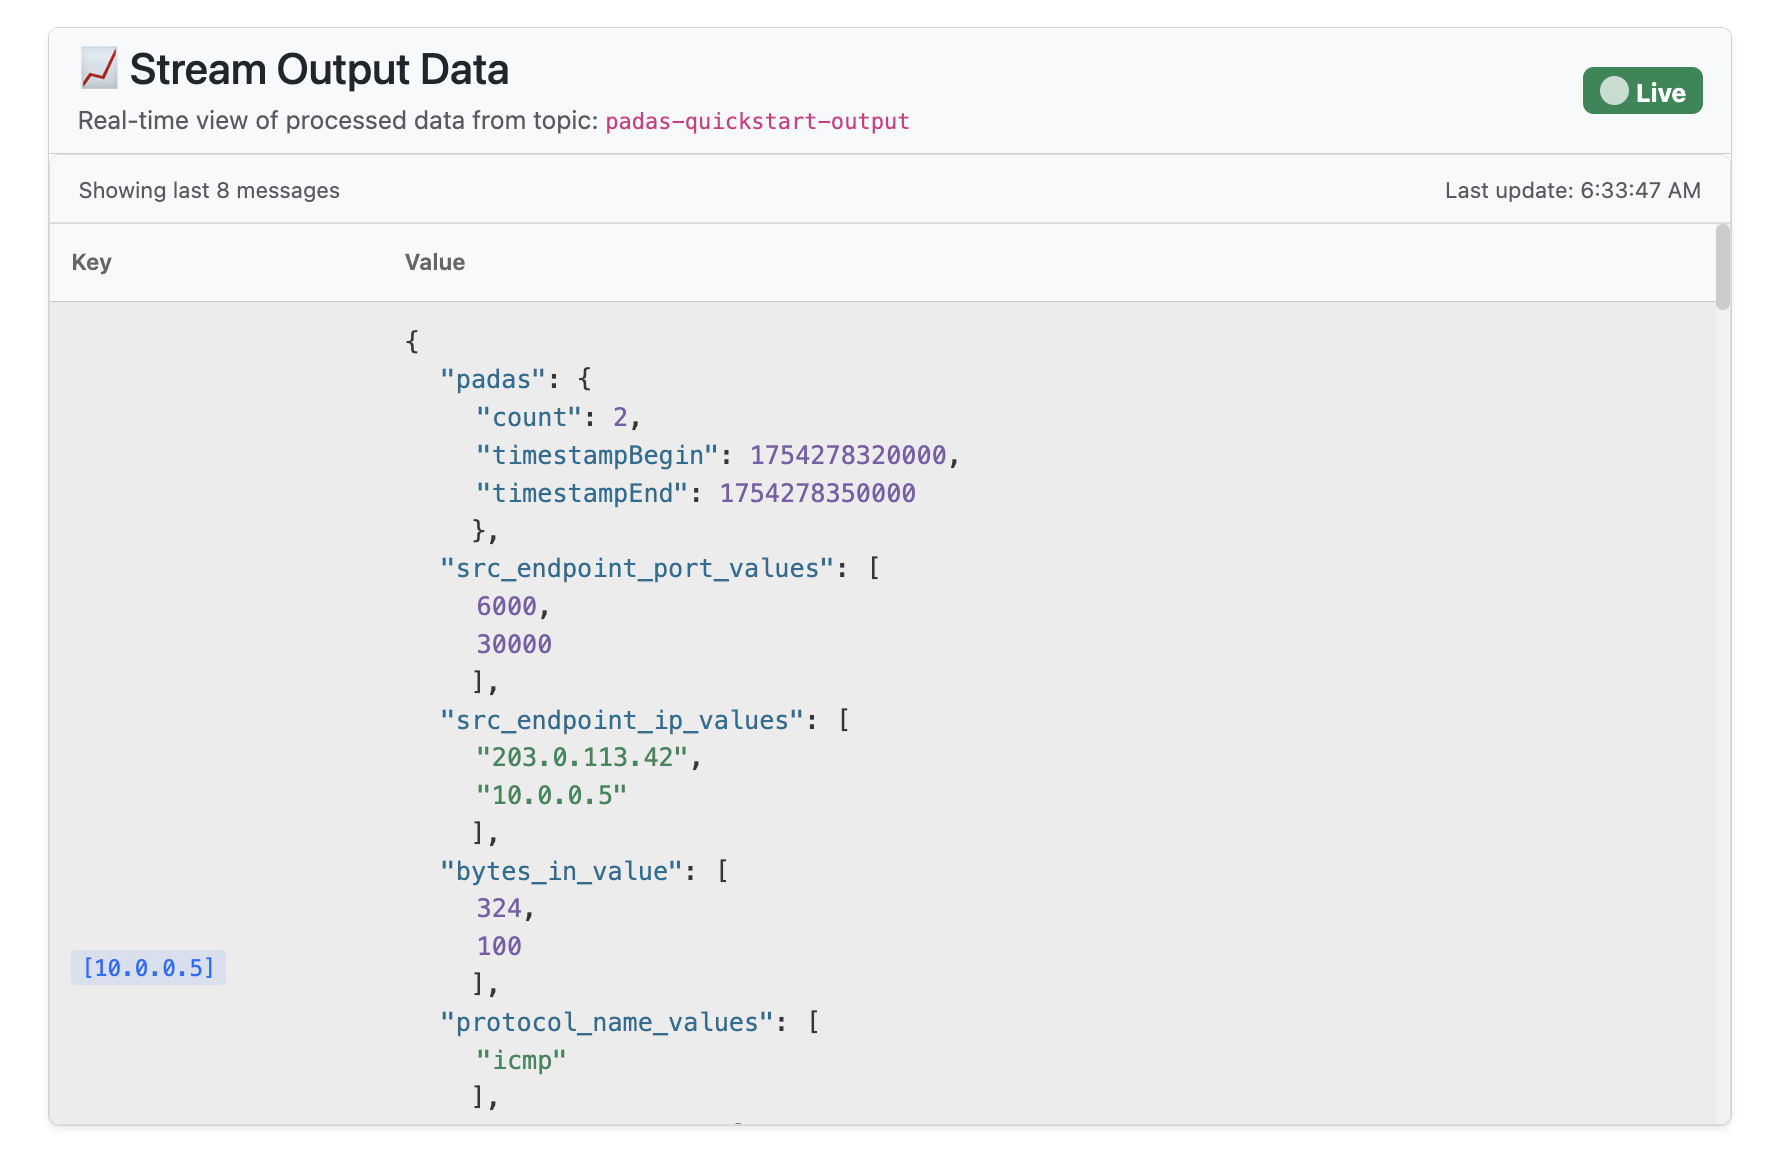
- Observe aggregated results showing potential ICMP-based attacks
- Watch the pipeline process FortiNet logs through the security monitoring workflow
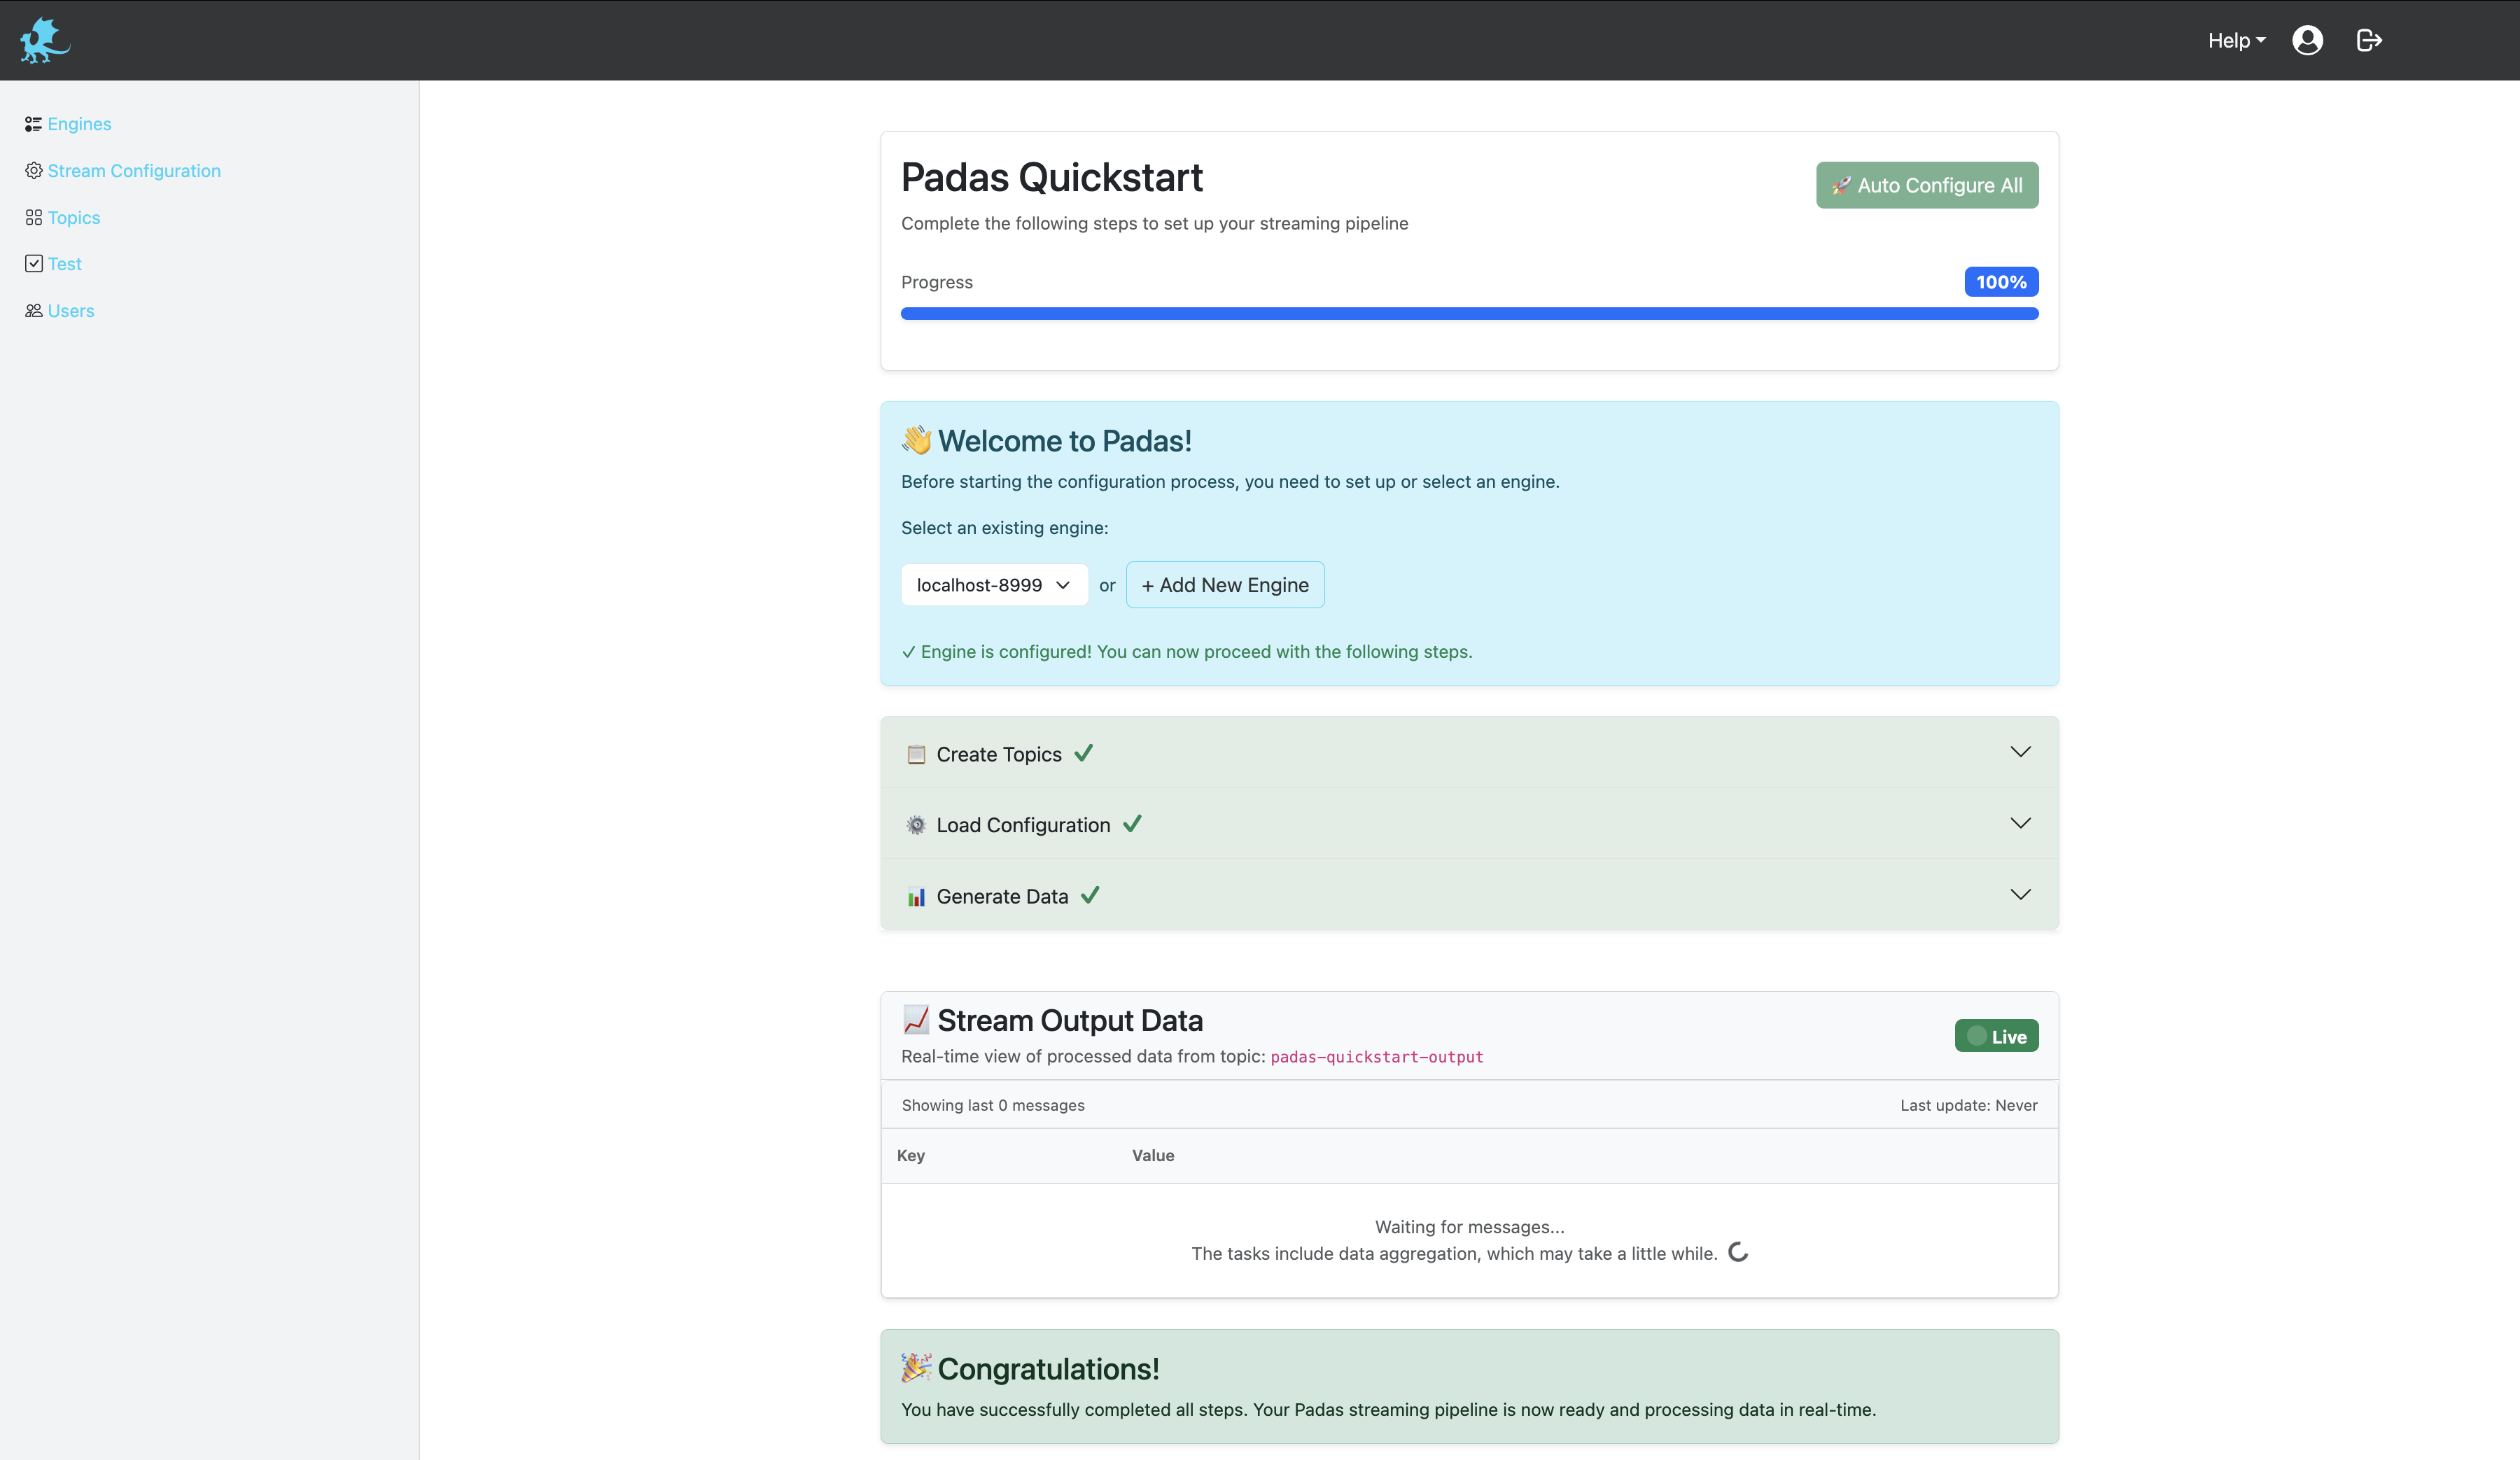
The system will now be processing the mock data and you can see the results in the output topics.
Step 7: Test and Explore Features
Now that everything is set up and running, you can:
- Test different pipeline configurations
- Modify transformation rules
- Experiment with different detection criteria
- Explore Padas's full capabilities for security analytics
- Try creating custom rules and pipelines
- Test with different data sources and formats
- Experiment with various PDL (Padas Data Language) functions
- Explore the UI features for pipeline management and monitoring
This is your playground to discover all the powerful features Padas offers for streaming event data transformations and security monitoring.