Inside the Motion Engine

I'd like to spend this post inside the Motion Engine. The previous post showed a pipeline from the outside with ingesting syslog data, filtering 'deny' events, a 30-second aggregation rollup to Splunk, and sending raw to S3, which is enough to get started but hides the parts I'd like to mention here. What happens when the downstream systems (e.g. SIEM) slows down? What survives a restart? Why does a task that counts things behave differently from one that parses things?
Those answers live in two objects: streams and tasks. Both carry more configuration surface than they first appear to, and that surface is deliberate. The knobs below are what let the same binary sit at a branch office dropping what it must, or in a datacenter with a durable log and a replay window.
TL;DR
- Streams carry events between connectors and tasks. Producers are source connectors and tasks; subscribers are tasks and sink connectors — many of each, independently.
- The write-ahead log is per stream, not a mode for the whole engine: enable where restart survival and replay matter, disable where throughput does.
- Bounded buffers plus a backpressure mode (
block,drop,timeout) decide what happens when a consumer falls behind. - Tasks run PDL in processing or detection mode across multiple workers, except when the query aggregates: then the engine pins it to one worker to keep window state correct.
- Batch and buffer limits exist for tuning configurations to scale up/down as resources (CPU and RAM) allow.
Streams
A stream is an append-only channel of events with a bounded buffer in front and an optional log behind it. It's the only way data moves inside the engine, and it's a first-class object for one reason: it decouples whoever writes (producer) from whoever reads (consumer/subscriber).
Producers and subscribers
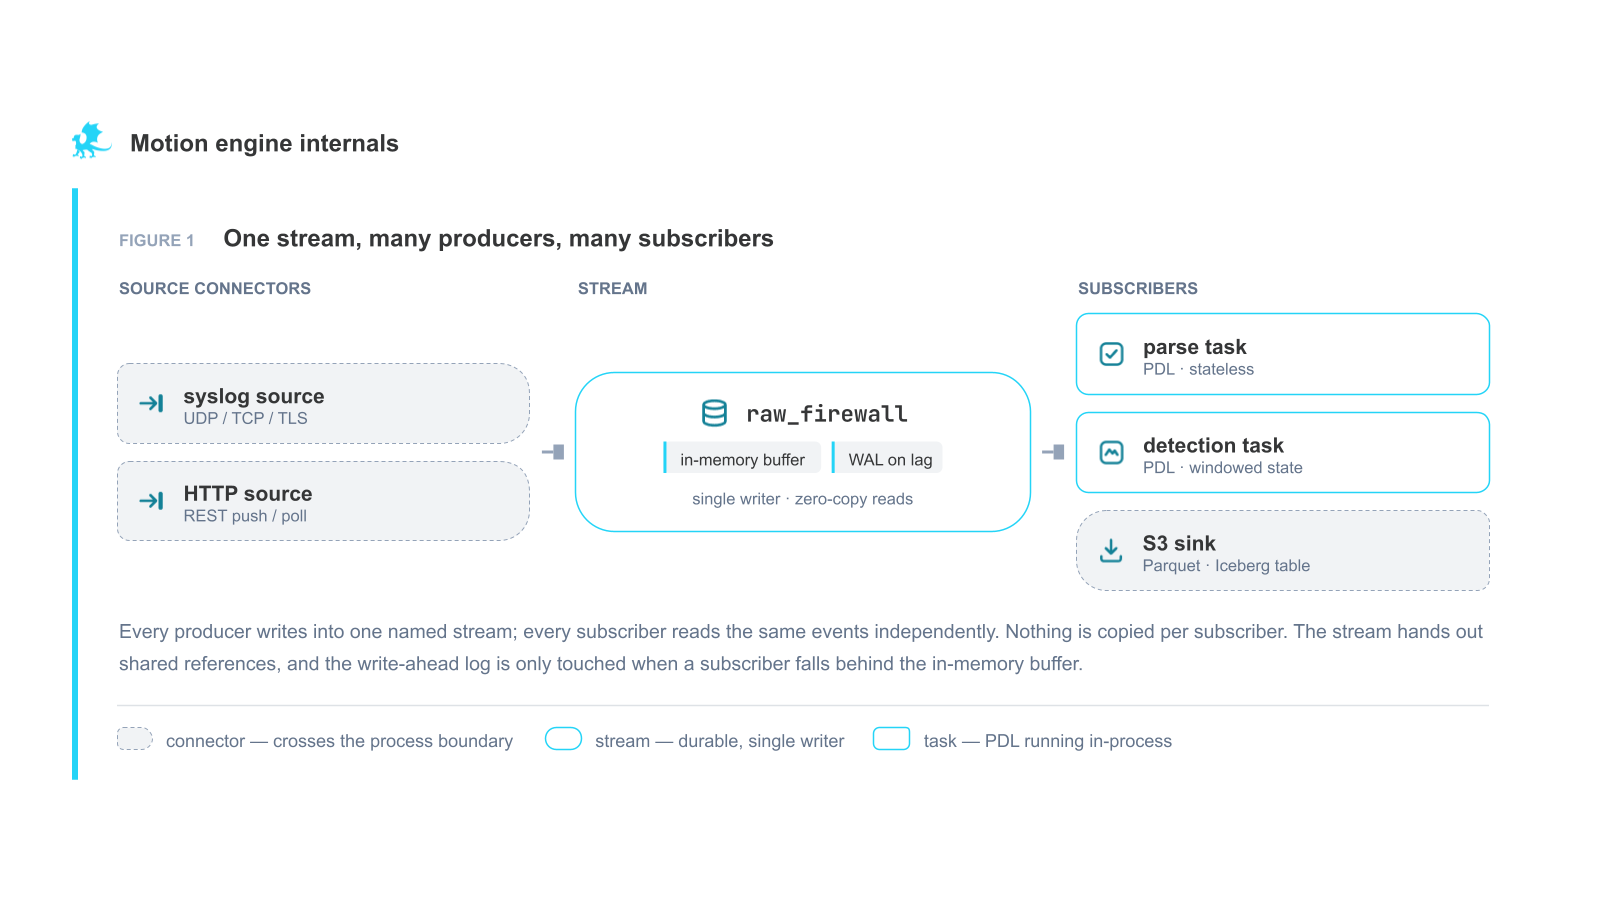
Two kinds of producer write to a stream: source connectors bringing data in from outside, and tasks publishing their results. Two kinds of subscriber read from one: tasks consuming events to process, and sink connectors delivering them onward.
None of that is exclusive. Several sources can feed one stream; a processing task and a detection task can read it at once, neither aware of the other; sinks subscribe independently and deliver at their own pace.
Durability: the write-ahead log
We can configure each stream for durability. When WAL is enabled, events persist to disk and consumers can read events from earliest, from an offset, or from latest. Within WAL structures we keep data in segments, which are sealed immutable objects, indexed, compressed (optional), and aged out by retention_ms or retention_bytes. By default, a stream is created without a WAL, where it runs in memory only (faster, no disk budget).
The pattern that works is mixed: WAL on ingest streams where re-reading is the difference between an incident and a shrug, intermediate fan-out stages in memory since replaying the prior stage regenerates them.
When we have WAL enabled for a stream, a subscriber that falls far enough behind the live buffer doesn't lose its place, it reads the sealed segments from its stored offset and catches up from disk.
Buffers, batches, and backpressure
Buffers are bounded on purpose (unbounded queues never report a problem, they absorb memory until the process dies). Each has a size (max_events), a timeout_ms, and a mode deciding what a producer does when it fills:
| Mode | Producer behavior | Where it fits |
|---|---|---|
block | Waits for space | Durability-first paths; you'd rather slow the source than lose an event |
drop | Discards immediately, counts it in metrics | High-volume ingest where a stalled receiver is worse than a gap |
timeout | Waits briefly, then drops | Bursty sources that recover on their own |
Batching is the throughput lever beside it: the WAL batches writes by bytes, events, and a timeout before flushing, use smaller values for latency and larger for throughput.
The engine's own streams
Motion's telemetry runs through the same machinery. _padas_metrics carries throughput, drop rates, and latency per stream, task, and connector; _padas_internal carries lifecycle events (connector starts, task errors, WAL rotations). Both are ordinary streams with their own retention settings; you can run PDL over them, route them to a sink, or scrape the same data from a Prometheus-compatible /metrics endpoint.
Tasks
A task subscribes to one source stream, runs PDL over each event, and publishes to one or more sink streams. It's a configuration that runs when a pipeline references it and that pipeline is deployed to an engine.
Processing and detection
Processing mode holds one inline PDL query where we can parse, filter, transform, enrich, or aggregate for desired output.
Detection mode holds one to many saved queries, each evaluated independently against the same event. A match emits a detection event with the query name and extracted fields; the task can stop at the first match or evaluate all of them.
Workers, and the aggregation rule
We can define parallel workers for each task: workers = 0 uses the available cores, 1 is sequential, N runs N workers in parallel.
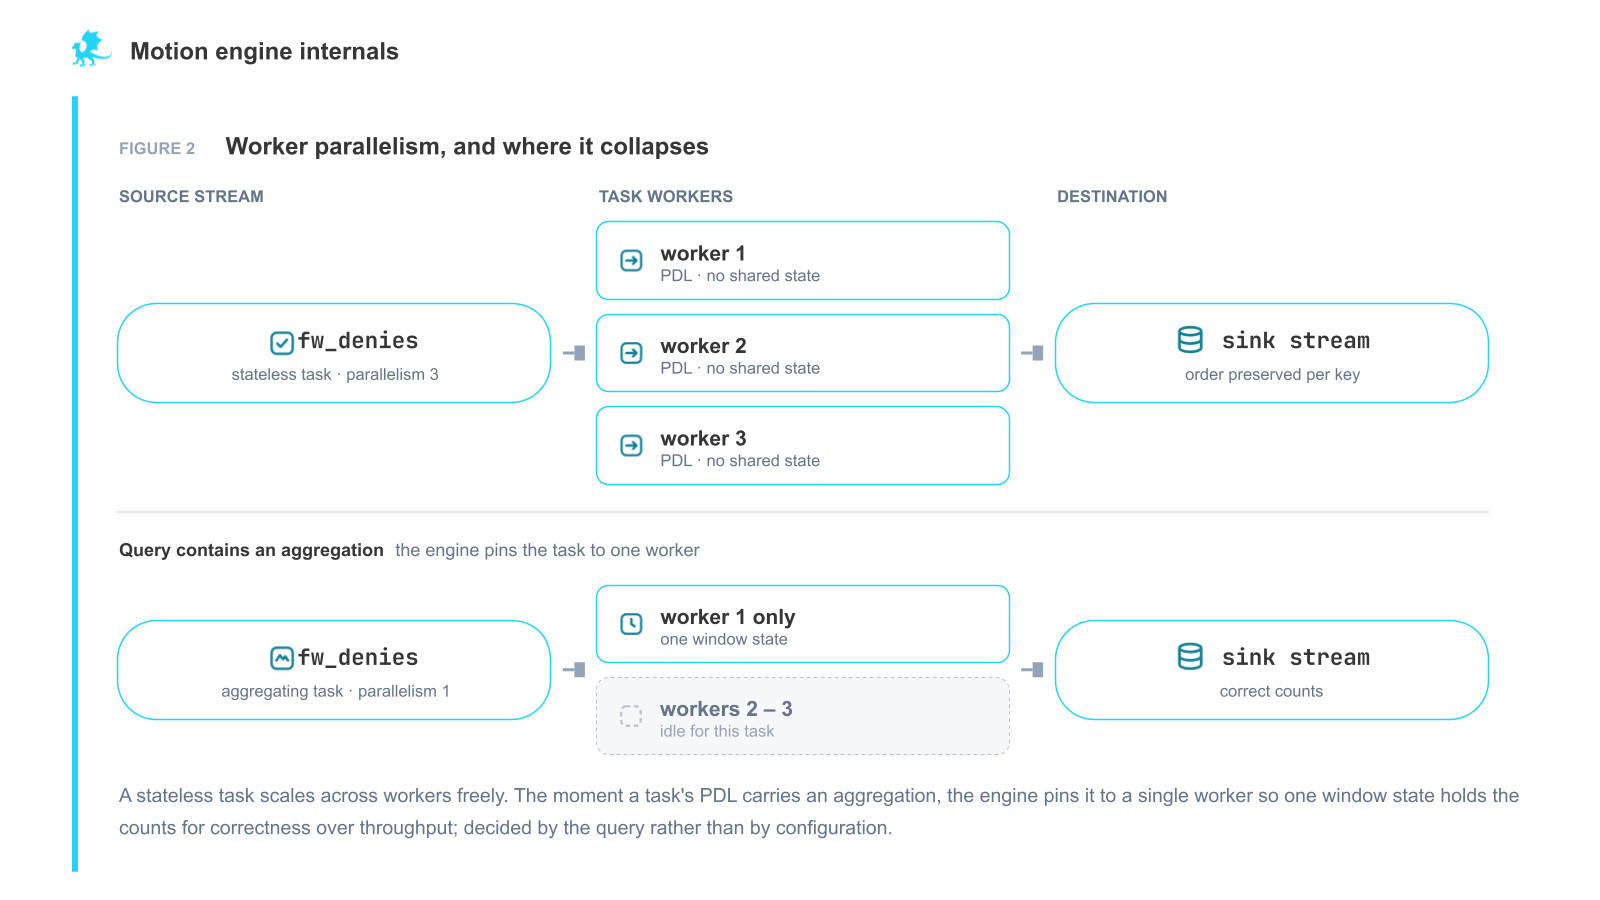
If the PDL contains an aggregation, the engine overrides the worker settings: workers drops to 1, with a warning explaining why. Three workers would mean three independent window states, each counting a third of the events and emitting its own rollup (three plausible small numbers instead of one correct one).
Therefore we'd like to parallelize the parsing, serialize the counting. Move expensive regex work in a multi-worker processing task, out to an intermediate stream, then a single-worker aggregation task over the already-reduced volume. The two-task split in the last post was that shape.
Buffers and batches on the task side
Tasks carry their own buffer and batch settings, mirroring the stream settings. Batch defaults are relatively small (50 events or 25 milliseconds), because a security pipeline that adds a second of latency to save syscalls is usually the wrong trade. Raise them when you're throughput-bound and can afford the wait.
Aggregation adds a cleanup interval bounding how long window state lives, plus watermark settings that flush idle windows and keep shutdown from swallowing the last partial one. Windows group by the event's own timestamp rather than arrival time, so out-of-order events still land where they belong.
What's next
Streams decide how events move and what survives; tasks decide what they become. Between them sit the settings that matter under load: WAL per stream, buffer size and backpressure mode per hop, batch sizes on both sides, worker counts wherever correctness doesn't override you.
What we haven't covered is the boundary: how events get in and out. That's the next post on source and sink connectors.
The PDL reference covers the language in full if you want it now. Follow along here or on LinkedIn for the rest of the series.